
Supply chains thrive on precision, planning, and efficiency – but let’s face it: real-world logistics is anything but predictable.
❌ Customers change their purchasing behavior
❌ Suppliers experience delays
❌ Shipments arrive at different times
So, how do businesses prepare for the unknown? The answer is probability distributions – powerful mathematical models that help supply chain professionals forecast demand, anticipate disruptions, and optimize operations.
In this blog, we’ll break down three key probability distributions – Normal, Poisson, and Triangle. We will explore how they impact real-life supply chain decision-making with unique, in-depth examples.
🚀 Bonus: At the end, we’ll show how SMEs can build these models in Excel - no complex software required!
Normal Distribution – The Science Behind Demand Forecasting
The Normal Distribution (or Bell Curve) models continuous data where values cluster around a central average, with fewer occurrences at the extremes.
🏪 Real-Life Example: Demand Forecasting for Supermarkets
Imagine you are the supply chain manager for a grocery store that sells fresh produce. You need to forecast how much milk to stock daily.
🔹On most days, demand is around 500 cartons of milk.
🔹Some days, demand dips to 450 or spikes to 550.
🔹Rarely, demand drops to 400 or surges past 600.
This demand pattern forms a bell curve, where the majority of sales hover around 500 but extremes are less likely.
🎯 Why It Matters in Supply Chain
🔹Retailers use normal distribution to optimize inventory levels, ensuring they don’t overstock (leading to waste) or understock (leading to lost sales).
🔹Warehouses use it for storage capacity planning, ensuring space is efficiently allocated based on average demand.
🔹Production teams rely on it for manufacturing schedules, preventing shortages or excess inventory.
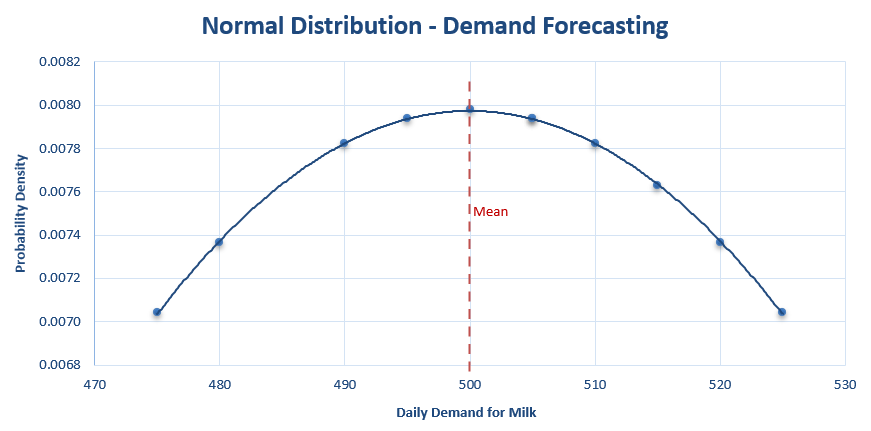
📊 Visualization:
Below is a graph representing the normal distribution of daily milk demand. The red dashed line marks the average daily demand (500 cartons), showing the probability of different demand levels.
While demand forecasting helps plan inventory, disruptions in supply chains require a different approach – enter Poisson Distribution.
Poisson Distribution – The Math Behind Supplier Delays
The Poisson Distribution models the occurrence of rare, discrete events (non-continuous, countable) over a fixed period (e.g., number of supplier delays, machine breakdowns, etc.).
🏪 Real-Life Example: Supplier Delays in Automotive Manufacturing
Consider you manage logistics for a car manufacturing plant. Your plant relies on 10 key suppliers for essential components (engine parts, seats, electronics, etc.).
🔹On average, you experience 5 supplier delays per month due to various reasons (weather, customs issues, etc.).
🔹Some months, you get only 2 delays, while others have 7+ delays.
🔹The delays don’t follow a strict pattern, but when observed over multiple months, they occur at a stable average rate.
🎯 Why It Matters in Supply Chain
🔹Predict the probability of X number of delays occurring in a given month.
🔹Allocate buffer stock for critical components to prevent production halts.
🔹Improve supplier contracts by setting penalty clauses for repeated late deliveries.
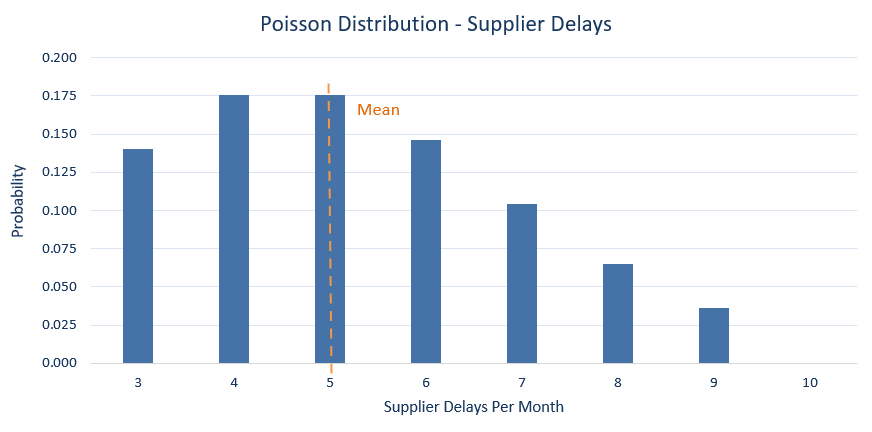
📊 Visualization:
The following bar chart shows the Poisson distribution of supplier delays, with the orange dashed line indicating the average of 5 delays per month.
Forecasting delays is useful, but what about uncertain shipping times? This is where Triangle Distribution helps.
Triangle Distribution – Estimating Shipping Lead Times
The Triangle Distribution is used when you have:
🔹A minimum value (best case scenario)
🔹A most likely value (expected scenario)
🔹A maximum value (worst case scenario)
🏪 Real-Life Example: Estimating Delivery Times in E-Commerce
You run an e-commerce business shipping products from Canada to Europe. Based on your past shipments:
🔹Best case: Orders arrive in 5 days (express shipping, no customs delays).
🔹Most likely case: Orders arrive in 8 days (standard transit time).
🔹Worst case: Orders take 12 days (peak season, customs inspections).
Since lead times don’t follow a normal pattern but vary between three known points, they fit a triangle distribution.
🎯 Why It Matters in Supply Chain
🔹Shipping companies use triangle distribution to set realistic delivery expectations for customers, balancing best and worst-case scenarios.
🔹Warehouses use it for fulfillment planning, ensuring sufficient capacity during peak delivery times.
🔹E-commerce businesses prevent customer dissatisfaction by adjusting delivery promises based on historical shipping trends.
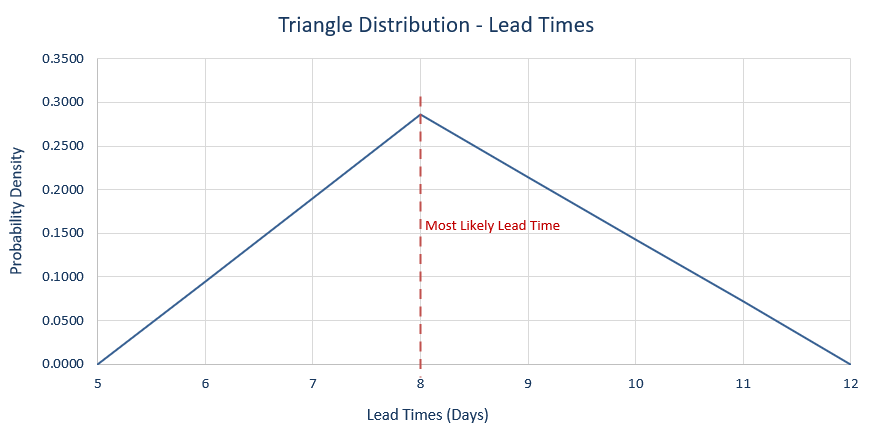
📊 Visualization:
The following graph represents the Triangle Distribution of shipping lead times, with the red dashed line indicating the most likely lead time (8 days).
📥Download SME Supply Chain Probability Models
Many small and medium enterprises (SMEs) don’t have access to advanced forecasting tools – but Excel can do the job just fine! Here’s how:
🔹Normal Distribution (Demand Forecasting) – Sample demand data with mean and standard deviation.
🔹Poisson Distribution (Supplier Delays) – Supplier delay tracking with probability calculations.
🔹Triangle Distribution (Shipping Lead Times) – Shipping times with min, most likely, and max estimates.
📊 Key Takeaways: How Probability Drives Supply Chain Success
🔹Probability models help optimize inventory, reduce delays, and improve logistics planning.
🔹Excel is a powerful tool that SMEs can leverage for forecasting and risk management.
💡Supply chain disruptions are unpredictable – but they don’t have to be unmanageable.
At NexaFlux, we help businesses leverage data-driven probability models to:
🔹Optimize inventory planning and reduce stockouts with accurate demand forecasting.
🔹Minimize supplier delays by predicting disruptions and implementing risk-mitigation strategies.
🔹Improve logistics efficiency by modeling lead times and refining delivery expectations.
🚀 Want to transform your supply chain with smarter forecasting and real-time analytics? Let’s talk! Contact NexaFlux today to make probability work for your supply chain.